
Do you know the history of discrimination in your community?
We delved into Waterloo, Iowa, for a podcast about the country’s racial wealth gap. What we saw included two types of real estate racism that played out coast to coast in the United States. Both erected barriers to wealth-building that still hurt people today, Black families especially, decades after the practices were declared illegal.
It’s a lot easier than it once was to see the local impact of one of those practices, known as redlining. That means you can go digging, too.
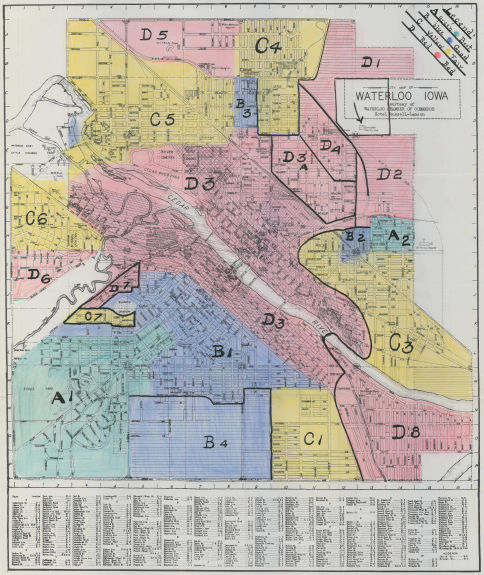
A federal agency called the Home Owners’ Loan Corp. graded neighborhoods in more than 200 cities nationwide during the 1930s, declaring some neighborhoods suitable for mortgage investment and some “hazardous.” The latter were colored red on HOLC maps — for reasons that included the race of the people living there.
“Redlining directed both public and private capital to native-born white families and away from African American and immigrant families,” concluded a team of researchers at four universities, including the University of Richmond, that put these maps online.
These maps redlined the country
To find out if your community was redlined by HOLC, go to the universities’ Mapping Inequality site. You’ll see not just the maps but also the justifications that federal employees gave for their grades.
Local bias in real estate and lending long predated HOLC. Researchers found that the agency’s maps reflected that reality more than they created it — and that the Federal Housing Administration was the real federal driver of discriminatory lending.
Why aren’t we looking at FHA’s redlining maps? Because few survived.
“They had been destroyed after being noticed by a Washington official in use in the regional office in Detroit,” Columbia University’s Lynne Sagalyn wrote in her 1980 dissertation.
You can see the 1938 Chicago map, with different colors designating grades A through D, which Wenfei Xu, a postdoctoral fellow at the University of Chicago, delved into for a paper about decades-long ripple impacts. Thomas Storrs, a history Ph.D. student at the University of Virginia, found an FHA map of Greensboro, North Carolina, with a literal red line through it — drawn in pencil — that appeared to be the demarcation between areas where the agency would and would not lend.
Most FHA maps still around from the redlining period have no color-coded grades or red lines. Instead, demographic and other data embedded in those maps “provided the tools for redlining and the division of cities,” said Storrs, co-author of a 2021 paper on the agency’s discriminatory lending.
But the HOLC maps are far more readily available and clear-cut. And they do tell an important story about historical patterns of segregation, discrimination and blocked investment — as well as their present-day consequences.
Want more of The Heist?
Get behind-the-scenes info and alerts when new episodes become available.
Use the unsubscribe link in those emails to opt out at any time.
Researchers found that even today, people in Baltimore neighborhoods graded “declining” or “hazardous” in the 1930s live shorter lives, for instance, and that babies born in redlined California neighborhoods have worse health outcomes. The nation’s redlined areas have lower homeownership rates and home values. And most today are communities of color.
In Waterloo, we found that nearly half the city’s Black residents live in census tracts where the predominant grade was “declining” or “hazardous,” compared with 20% of white residents. Big disparities in income and homeownership plague the city.
“Fifty years after the Fair Housing Act, we’re still struggling with this,” said Jerry Anthony, an associate professor at the University of Iowa who has studied segregation in the state as well as lending discrimination. “We still haven’t made significant progress.”

Restrictions hidden in land records
Another practice used in Waterloo to enforce segregation: covenants filed in land records to restrict who could move in based on their race.
That was common across the country, too — FHA recommended their use. But there’s no website where you can look them all up.
So if you want to know whether a racially restrictive covenant was filed for your own home, you’ll likely need to check your property records for evidence of restrictions. Houses more likely to have them were built in the first half of the 20th century.
In some locations, though, someone’s already done the legwork to find many or all of the local covenants.
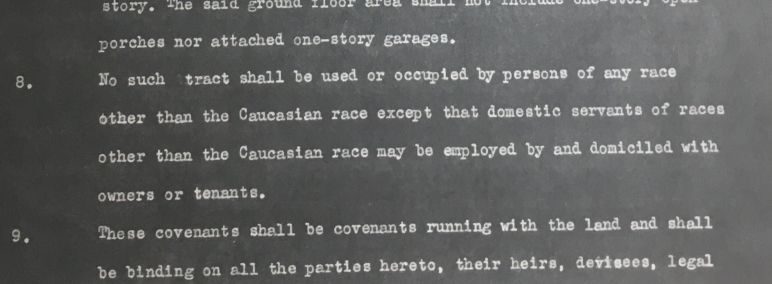
A passage in a racially restrictive covenant in Waterloo, Iowa. (Source: Mapping Segregation in Iowa) 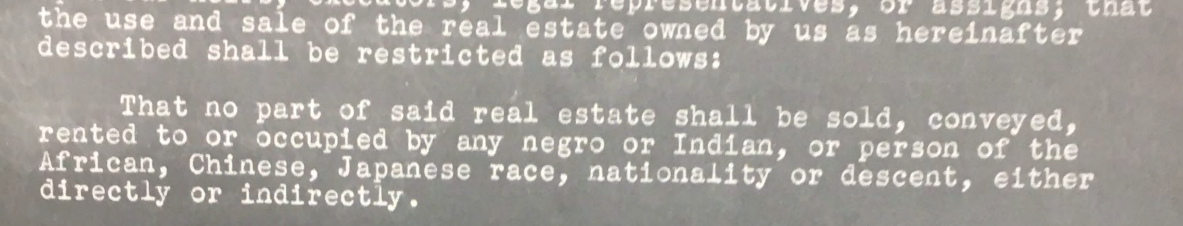
A passage in a racially restrictive covenant in Waterloo, Iowa. (Source: Mapping Segregation in Iowa) 
A passage in a racially restrictive covenant in Waterloo, Iowa. (Source: Mapping Segregation in Iowa) 
A passage in a racially restrictive covenant in Waterloo, Iowa. (Source: Mapping Segregation in Iowa)
In the Minneapolis area. In Washington, D.C. In the St. Louis area. In Seattle’s King County.
“Most shocking is the ‘Aryans only’ restriction imposed on a subdivision in Clyde Hill,” the University of Washington’s Seattle Civil Rights & Labor History Project wrote on its website. “That racial concept, favored by [Adolf] Hitler, was written into deeds as late as 1948.”
And the influence went both ways: Hitler used U.S. race laws as a model for Nazi Germany, Yale Law School’s James Q. Whitman says.
Colin Gordon, a professor of history at the University of Iowa, coordinated students cataloging covenants in two Iowa counties. Very fortunately for us, one of them was Black Hawk County, where Waterloo is located.
“Fifty years after the Fair Housing Act, we’re still struggling with this.”
Jerry Anthony, associate professor at the University of Iowa
Tracking down the documents is usually tricky, requiring a hunt through deed books, Gordon said. But the Black Hawk recorder’s office filed all the restrictive covenants as “miscellaneous” records, making it much simpler.
The resulting Mapping Segregation in Iowa project shows the underlying documents, often with bland language that sounds like a current-day homeowners’ association rulebook until you get to wording like this: “No race or nationality other than the Caucasian race shall use or occupy any building or any lot, except that this covenant shall not prevent occupancy by domestic servants.”
There’s also a map that lets you see these restrictions spreading across Waterloo from 1914 to 1950 like a contagion.
“It’s a response to the Great Migration,” Gordon said. The first covenants in Waterloo were placed by white homeowners living near an area where Black migrants from the South, seeking a better life, moved to work on the railroad. It was an effort, he said, “to seal the borders.”
After that, developers of new subdivisions and residents of other neighborhoods both followed suit.
In 1948, the U.S. Supreme Court said judges could not enforce the documents but people could still adhere to them — which they did. The Fair Housing Act finally made that, and redlining, illegal in 1968.
Even if discrimination stopped after that, which it did not, these past practices would still matter today. They defined for decades which neighborhoods received public investment, mortgages and other resources. If you lived somewhere else, it was far harder — or impossible — to accumulate the modest wealth of the middle class. That meant less to pass on to children and grandchildren.
“You have intergenerational disadvantage,” Gordon said.
And that is why we dug into this history (and more) for a podcast about the present-day racial wealth gap and one woman’s effort to address it in Waterloo.
Moritz Kuhn, an economics professor at the University of Bonn in Germany, was part of a research team that showed how the wealth gap between Black and white Americans has changed over time. Measured in dollars, it didn’t shrink over the past 60 years. It grew.
Kuhn said the “dramatically different” wealth positions of Black and white Americans right after the Civil War, the result not just of slavery but of decisions by the country about whom to compensate for it, is enough to create a long-lasting disparity all by itself.
Then redlining, restrictive covenants and other discriminatory actions piled on.
“The situation that we see today is still very much inherited from 150 years ago,” Kuhn said.